 "The January report shows that the average starting salary for petroleum engineering is nearly $27,000 more than the average starting salary for computer engineering, which is the second highest-paid major for Class of 2013 graduates." See the complete report at this link: NACEWeb.org |
22 January 2014
• Engineers Top College Grad Salaries
17 January 2014
• U.S. Job Openings, Labor Turnover – November 2013
 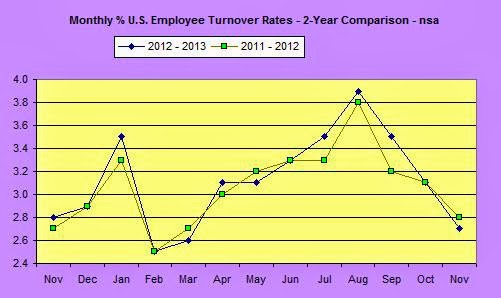 See the complete report at this link: USDOL-BLS |
16 January 2014
• U.S. Real Earnings – December 2013
 Real average weekly earnings fell 0.5 percent over the month due to the decrease in real average hourly earnings combined with a 0.3 percent decrease in the average workweek. Real average hourly earnings rose 0.2 percent, seasonally adjusted, from December 2012 to December 2013. The increase in real average hourly earnings, combined with a 0.3 percent decrease in the average workweek, resulted in no net change in real average weekly earnings over this period. See the complete report at this link: USDOL-BLS |
• U.S. Initial Unemployment Claims – 11 January 2014
In the week ending January 11, the advance figure for seasonally adjusted initial claims was 326,000, a decrease of 2,000 from the previous week's revised figure of 328,000.  The advance seasonally adjusted insured unemployment rate was 2.3 percent for the week ending January 4, an increase of 0.1 percentage point from the prior week's unrevised rate. The highest insured unemployment rates in the week ending December 28 were in Alaska (6.2), New Jersey (4.0), Connecticut (3.8), Pennsylvania (3.6), Montana (3.5), Wisconsin (3.5), Oregon (3.4), California (3.2), Illinois (3.2), Idaho (3.1), Massachusetts (3.1), Michigan (3.1), Minnesota (3.1), New York (3.1), and Rhode Island (3.1). The largest increases in initial claims for the week ending January 4 were in New York (+28,314), Georgia (+18,734), South Carolina (+9,632), Alabama (+6,782), and Texas (+6,638), while the largest decreases were in Michigan (-17,635), New Jersey (-6,882), Massachusetts (-5,485), Ohio (-5,482), and Iowa (-4,212). Click on chart to enlarge Note: “Insured unemployment rate” refers to individuals who are unemployed and receiving UC benefits. See the complete report at this link: USDOL-BLS |
• U.S. Consumer Price Index – December 2013
The Consumer Price Index for All Urban Consumers (CPI-U) increased
1.5 percent over the last 12 months to an index level of 233.049
(1982-84=100). For the month, the index was unchanged prior to
seasonal adjustment.
 The Chained Consumer Price Index for All Urban Consumers (C-CPI-U) increased 1.3 percent over the last 12 months to an index level of 133.662. For the month, the index was unchanged on a not seasonally adjusted basis. Please note that the indexes for the post-2011 period are subject to revision. The Consumer Price Index for January 2014 is scheduled to be released on Thursday, February 20, 2014, at 8:30 a.m. (EST). See the complete report at this link: USDOL-BLS |
15 January 2014
• U.S. Producer Price Index – December 2013
The Producer Price Index for finished goods advanced 0.4 percent in December, seasonally
adjusted. Prices for finished goods declined
0.1 percent in November and 0.2 percent in October.
 On an unadjusted basis, prices for finished goods increased 1.2 percent in 2013 compared with a 1.4-percent advance in 2012. See the complete report at this link: USDOL-BLS |
10 January 2014
• U.S. Online Help-Wanted Advertising – December 2013
| ”Online advertised vacancies were up 125,600 in December to 5,297,100, according to
The Conference Board Help Wanted OnLine® (HWOL) Data Series.... "The November Supply/Demand rate stands at 2.1 unemployed for each vacancy with a total of 5.7 million more unemployed workers than the number of advertised vacancies.” See the complete report at this link: The Conference Board |
Subscribe to:
Posts (Atom)