| The number of job openings (not seasonally adjusted) increased over the year for total nonfarm and total
private but decreased for government. Over the year, the number of job openings increased in several
industries while it decreased in real estate and rental and leasing and in federal government.
Over the 12 months ending in January, the number of hires (not seasonally adjusted) changed little for total nonfarm, total private, and government. Hires levels rose over the year in professional and business services and in educational services. See the complete report at this link: USDOL-BLS |
Showing posts with label Turnover. Show all posts
Showing posts with label Turnover. Show all posts
11 March 2014
• U.S. Job Openings, Hires, Turnover – January 2014
11 February 2014
• U.S. Job Openings, Hires, & Labor Turnover – December 2013
| The number of job openings (not seasonally adjusted) increased over the year for total nonfarm and total
private and was little changed for government. Over the year, the number of job openings increased in mining and logging; nondurable goods manufacturing; wholesale trade; professional and business services; and accommodation and food services. The job openings level decreased in healthcare and social assistance as well as federal government. See the complete report at this link: USDOL-BLS |
17 January 2014
• U.S. Job Openings, Labor Turnover – November 2013
  See the complete report at this link: USDOL-BLS |
10 December 2013
• U.S. Labor Turnover – October 2013
•
 Click on chart to enlarge October’s turnover was lower than that of the prior month’s 4.833 million, but higher that that of the same month a year ago, 4.170 million. This yielded a monthly turnover level of 3.1% [the number of total separations during the entire month as a percent of total employment]…or 37.2% annualized.  See the complete report at this link: USDOL-BLS |
• U.S. Job Openings and Hires – October 2013

Hires: U.S. employers hired 4.746 million workers in October, down 1.6% from the previous month but up 5.3% from the same month a year ago. Source: USDOL-BLS Click on chart to enlarge |
22 November 2013
• U.S. Labor Turnover, Quits, Layoffs – September 2013
 In September, 2.57 million resignations yielded a quits rate of 1.9%, up from 1.6% last year. U.S. employers laid off or fired 1.85 million workers, up a bit from August’s figure. See the complete report at this link: USDOL-BLS |
24 October 2013
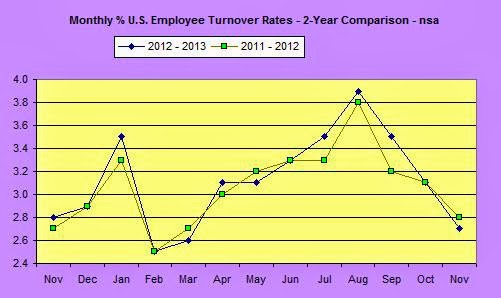
• Job Openings and Labor Turnover – August 2013
| There were 3.9 million job openings [sa] on the last business day of August, little changed from July.
The hires rate (3.3 percent) and separations [turnover] rate (3.2 percent) also were little changed in August [sa].  Click on chart to enlarge. See the complete report at this link: USDOL-BLS |
Subscribe to:
Posts (Atom)