 Click on charts to enlarge Click on charts to enlargeThe unemployment rate declined from 7.0 percent to 6.7 percent in December, while total nonfarm payroll employment edged up (+74,000).  See the complete report at this link: USDOL-BLS |
10 January 2014
• U.S. Employment Situation – December 2013
• U.S. College Grads: Salaries Up 2.6% for Class of 2013
”The overall average starting salary for Class of 2013 graduates has increased 2.6 percent to $45,633 from the
final overall average of $44,482 for the Class of 2012.
 ”Average salaries within the other broad categories of disciplines remain essentially flat, with some groups even slipping a little from last year—albeit by decreases of less than 1 percent. See the complete report at this link: NACEWeb.org |
09 January 2014
• U.S. Initial Unemployment Claims – 04 January 2014
In the week ending January 4, the advance figure for seasonally adjusted initial claims was 330,000, a decrease of 15,000 from the previous week's revised figure of 345,000. 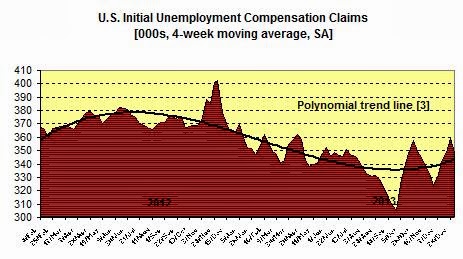 The advance seasonally adjusted insured unemployment rate was 2.2 percent for the week ending December 28, unchanged from the prior week's unrevised rate. The highest insured unemployment rates in the week ending December 21 were in Alaska (5.3), Pennsylvania (3.4), New Jersey (3.3), Connecticut (3.2), Illinois (3.1), Montana (3.0), Puerto Rico (2.9), Wisconsin (2.9), California (2.8), Nevada (2.8), Oregon (2.8), and Rhode Island (2.8). The largest increases in initial claims for the week ending December 28 were in Michigan (+16,056), Pennsylvania (+10,601), New Jersey (+7,345), Ohio (+7,036), and Iowa (+5,369), while the largest decreases were in California (-14,635), Texas (-6,723), Florida (-3,738), North Carolina (-2,694), and South Carolina (-2,184). Click on chart to enlarge Note: “Insured unemployment rate” refers to individuals who are unemployed and receiving UC benefits. See the complete report at this link: USDOL-BLS |
08 January 2014
• U.S. 2014-15 Occupational Outlook Handbook
The 2014–15 Occupational Outlook Handbook (OOH) was released today by the U.S.
Bureau of Labor Statistics (BLS). The OOH reflects BLS employment projections
for the 2012–22 decade.
 The OOH is available online at this link: USDOL-BLS |
• Business Economists Say U.S. Labor Markets to Improve
 ”However, panelists anticipate stronger job creation in 2014, with an average monthly nonfarm payroll increase of 197,000. ”The unemployment rate is expected to average 7.5% in 2013 and decline to 7.0% in 2014. ”Affordable Care Act provisions are expected to trim 10,000 from monthly payroll growth in 2014. See the complete report at this link: NABE |
07 January 2014
• U.S. Metropolitan Area Employment And Unemployment - November 2013
Unemployment rates were lower in November than a year earlier in 293 of the 372
metropolitan areas, higher in 71 areas, and unchanged in 8 areas. Twenty-one areas had jobless rates of at least
10.0 percent, and 73 areas had rates of less than 5.0 percent. Two hundred ninety-
eight metropolitan areas had over-the-year increases in nonfarm payroll employment,
63 had decreases, and 11 had no change.
 298 metropolitan areas had over-the-year increases in nonfarm payroll employment, 63 had decreases, and 11 had no change. The largest over-the-year employment increases occurred in New York-Northern New Jersey-Long Island, N.Y.-N.J.-Pa. (+200,500), Los Angeles-Long Beach-Santa Ana, Calif. (+97,600), and Houston-Sugar Land-Baytown, Texas (+86,200). The largest over-the-year percentage gain in employment occurred in Sebastian-Vero Beach, Fla. (+8.1 percent), followed by Naples-Marco Island, Fla. (+7.9 percent), and Port St. Lucie, Fla. (+6.1 percent). See the complete report at this link: USDOL-BLS |
02 January 2014
• U.S. Initial Unemployment Claims – 28 December 2013
In the week ending December 28, the advance figure for seasonally adjusted initial claims was 339,000, a decrease of 2,000 from the previous week's revised figure of 341,000.  The advance seasonally adjusted insured unemployment rate was 2.2 percent for the week ending December 21, unchanged from the prior week's unrevised rate. The highest insured unemployment rates in the week ending December 21 were in Alaska (6.1), New Jersey (3.8), California (3.4), Montana (3.3), Pennsylvania (3.3), Connecticut (3.2), Puerto Rico (3.2), Illinois (3.0), Wisconsin (3.0), Oregon (2.9), West Virginia (2.9), and Nevada (2.8). The largest increases in initial claims for the week ending December 21 were in Michigan (+4,865), New York (+3,284), Oregon (+1,901), New Jersey (+1,887), and Kentucky (+1,538), while the largest decreases were in California (-5,429), Illinois (-3,509), Washington (-1,930), Minnesota (-1,627), and Indiana (-1,363). Click on chart to enlarge Note: “Insured unemployment rate” refers to individuals who are unemployed and receiving UC benefits. See the complete report at this link: USDOL-BLS |
Subscribe to:
Posts (Atom)