| In the week ending September 6, the advance figure for seasonally adjusted initial claims was 315,000, an increase of
11,000 from the previous week's revised level and up 2.6% from the same week a year ago. The previous week's level was revised up by 2,000 from 302,000 to
304,000.
The 4-week moving average was 304,000, an increase of 750 from the previous week's revised average. The previous week's average was revised up by 500 from 302,750 to 303,250. The advance seasonally adjusted insured unemployment rate was 1.9 percent for the week ending August 30, unchanged from the previous week's unrevised rate. The advance number for seasonally adjusted insured unemployment during the week ending August 30 was 2,487,000, an increase of 9,000 from the previous week's revised level. The highest insured unemployment rates in the week ending August 23 were in Puerto Rico (3.9), New Jersey (3.3), Connecticut (3.0), Alaska (2.9), California (2.6), Pennsylvania (2.6), Massachusetts (2.5), Rhode Island (2.5), Virgin Islands (2.4), Illinois (2.2), Nevada (2.2), and New York (2.2). The largest increases in initial claims for the week ending August 30 were in California (+1,563), New York (+1,254), Iowa (+579), Wisconsin (+412), and Pennsylvania (+362), while the largest decreases were in New Jersey (-901), Illinois (-633), Georgia (-465), Massachusetts (-345), and Kentucky (-324). Note: “Insured unemployment rate” refers to individuals who are unemployed and receiving UC benefits. See the complete report at this link: USDOL-BLS |
11 September 2014
• U.S. Initial Unemployment Claims – 06 September 2014
10 September 2014
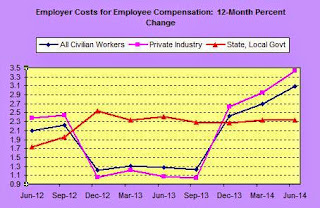
• Employer Costs For Employee Compensation – June 2014
| Private industry employers spent an average of $30.11 per hour worked for employee compensation in
June 2014. Wages and salaries averaged $21.02 per
hour worked and accounted for 69.8 percent of these costs, while benefits averaged $9.09 and accounted
for the remaining 30.2 percent.
Total compensation costs for state and local government workers averaged $43.07 per hour worked in June 2014. Total compensation costs for civilian workers, which include private industry and state and local government workers, averaged $31.96 per hour worked in June 2014. See the complete report at this link: USDOL-BLS |
09 September 2014
• U.S. Job Openings, Hires, and Labor Turnover – July 2014
| There were 4.7 million job openings on the last business day of July and the rate was 3.3 percent. The
1-month change in the number of openings was not significant for total private, government, all
industries, and in all four regions.
Although the number of total nonfarm job openings was little changed in July, there were 799,000 more job openings in July than in January 2014. The largest increases since January were in retail trade, professional and business services, and health care and social assistance. See the complete report at this link: USDOL-BLS Click on chart to enlarge. |
08 September 2014
• Class of 2014 Grad Starting Salaries Climb 7.5%
|
“The overall average starting salary for Class of 2014 college graduates stands at $48,707, up 7.5 percent from the average of $45,327 posted by the Class of 2013 at this time last year, according to a new report by the National Association of Colleges and Employers (NACE).
”An executive summary of the September 2014 Salary Survey report is available at www.naceweb.org/salary-resources/salary-survey.aspx. "The final Salary Survey report for Class of 2014 graduates will be published in January 2015. See the press release at this link: NACE |
05 September 2014
• U.S. Employment Situation – August 2014
| In August, both the unemployment rate (6.1 percent) and the number of unemployed
persons (9.6 million) changed little. Over the year, the unemployment rate and
the number of unemployed persons were down by 1.1 percentage points and 1.7 million,
respectively.
Among the major worker groups, the unemployment rates in August showed little or no change for adult men (5.7 percent), adult women (5.7 percent), teenagers (19.6 percent), whites (5.3 percent), blacks (11.4 percent), and Hispanics (7.5 percent). The jobless rate for Asians was 4.5 percent (not seasonally adjusted), little changed from a year earlier. See the complete report at this link: USDOL-BLS |
04 September 2014
• U.S. Productivity and Unit Labor Costs – Q2 2014
| Productivity increased 2.3 percent in the nonfarm business sector in the second quarter of 2014; unit labor costs decreased 0.1 percent (seasonally adjusted annual rates).
In manufacturing, productivity increased 3.3 percent and unit labor costs decreased 1.6 percent. See the complete report at this link: USDOL-BLS |
• U.S. Initial Unemployment Claims – 30 August 2014
| In the week ending August 30, the advance figure for seasonally adjusted initial claims was 302,000, an increase of
4,000 from the previous week's unrevised level of 298,000. The 4-week moving average was 302,750, an increase of
3,000 from the previous week's unrevised average of 299,750.
The advance seasonally adjusted insured unemployment rate was 1.9 percent for the week ending August 23, unchanged from the previous week's unrevised rate. The advance number for seasonally adjusted insured unemployment during the week ending August 23 was 2,464,000, a decrease of 64,000 from the previous week's revised level. The highest insured unemployment rates in the week ending August 16 were in Puerto Rico (4.0), New Jersey (3.3), Alaska (3.1), Connecticut (3.1), Pennsylvania (2.8), California (2.7), Rhode Island (2.7), Massachusetts (2.5), and Nevada (2.5). The largest increases in initial claims for the week ending August 23 were in New York (+2,560), Michigan (+1,845), California (+867), Illinois (+613), and Texas (+308), while the largest decreases were in Georgia (-1,369), Massachusetts (-1,283), Pennsylvania (-1,031), Iowa (-1,016), and Alabama (-689). Note: “Insured unemployment rate” refers to individuals who are unemployed and receiving UC benefits. See the complete report at this link: USDOL-BLS |


