30 October 2015

• U.S. Personal Income — September 2015

Personal income increased $18.6 billion, or 0.1 percent, and disposable personal income (DPI) increased $19.2 billion, or 0.1 percent, in September. Personal consumption expenditures (PCE) increased $15.6 billion, or 0.1 percent. In August, personal income increased $54.9 billion, or 0.4 percent, DPI increased $49.5 billion, or 0.4 percent, and PCE increased $44.2 billion, or 0.4 percent, based on revised estimates.

Real DPI increased 0.2 percent in September, compared with an increase of 0.4 percent in August. Real PCE increased 0.2 percent, compared with an increase of 0.4 percent.

• Compensation: Wages and salaries decreased $3.7 billion in September, in contrast to an increase of $36.0 billion in August. Private wages and salaries decreased $7.0 billion, in contrast to an increase of $32.2 billion. Government wages and salaries increased $3.3 billion, compared with an increase of $3.8 billion. Supplements to wages and salaries increased $3.3 billion in September, compared with an increase of $6.4 billion in August.

Please visit this link to read the full report: USDOC-BEA

NOTE: This report is provided with the understanding that the publisher is not engaged in providing legal, financial, accounting or other professional advice. If professional assistance is required, the services of a competent professional should be sought. Furthermore, while we do our best to ensure that these data are accurate, we suggest that any entity making decisions based on these numbers should verify the data at their source prior to making such decisions.

© 2015 Connecticut Human Resource Reports, LLC

URL: http://connecticuthumanresources.blogspot.com/

• U.S. Employment Cost Index — September 2015

Civilian Workers: Compensation costs for civilian workers increased 2.0 percent for the 12-month period ending in September 2015. In September 2014, compensation costs increased 2.2 percent. Wages and salaries increased 2.1 percent for the current 12-month period, unchanged from the 12-month period ending in September 2014. Benefit costs increased 1.8 percent for the 12-month period ending in September 2015. In September 2014, the increase was 2.4 percent.

Private Industry Workers: Compensation costs for private industry workers increased 1.9 percent over the year, slowing from the previous year’s increase of 2.3 percent. Wages and salaries increased 2.1 percent for the current 12- month period. The increase for the 12-month period ending in September 2014 was 2.3 percent. The increase in the cost of benefits was 1.4 percent for the 12-month period ending in September 2015, lower than a year earlier when the increase was 2.3 percent.

State and Local Government Workers: Compensation costs for state and local government workers increased 2.3 percent for the 12-month period ending in September 2015. In September 2014, the increase was 2.1 percent. Wages and salaries increased 1.8 percent for the 12-month period ending in September 2015, and a year earlier the increase was 1.6 percent. Benefit costs increased 3.0 percent in September 2015, unchanged from the 12-month period ending in September 2014.

Please visit this link to read the full report: USDOL-BLS

NOTE: This report is provided with the understanding that the publisher is not engaged in providing legal, financial, accounting or other professional advice. If professional assistance is required, the services of a competent professional should be sought. Furthermore, while we do our best to ensure that these data are accurate, we suggest that any entity making decisions based on these numbers should verify the data at their source prior to making such decisions.

© 2015 Connecticut Human Resource Reports, LLC

URL: http://connecticuthumanresources.blogspot.com/


29 October 2015

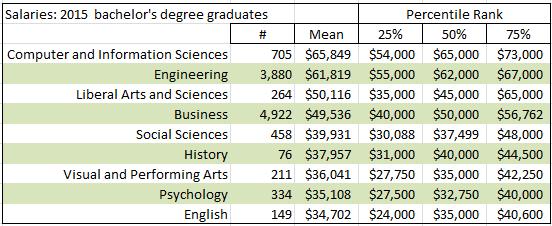
• U.S. College Grad Starting Salaries — Class of 2015

“The overall average salary for bachelor's degree graduates from the Class of 2015 is 5.2 percent higher than the final salary reported for the Class of 2014, according to a new report from the National Association of Colleges and Employers (NACE).

”NACE's Fall 2015 Salary Survey shows that the overall average salary for bachelor's degree graduates from the Class of 2015 is $50,651, compared to the final salary of $48,127 for Class of 2014 graduates.…”

Please visit this link to read the full report: NACE

NOTE: This report is provided with the understanding that the publisher is not engaged in providing legal, financial, accounting or other professional advice. If professional assistance is required, the services of a competent professional should be sought. Furthermore, while we do our best to ensure that these data are accurate, we suggest that any entity making decisions based on these numbers should verify the data at their source prior to making such decisions.

© 2015 Connecticut Human Resource Reports, LLC

URL: http://connecticuthumanresources.blogspot.com/


• U.S. Employer-Reported Workplace Injuries And Illnesses — 2014

The nearly 3.0 million nonfatal workplace injuries and illnesses reported by private industry employers in 2014 occurred at a rate of 3.2 cases per 100 equivalent full-time workers, according to estimates from the Survey of Occupational Injuries and Illnesses (SOII) conducted by the U.S. Bureau of Labor Statistics. The rate reported for 2014 continues a pattern of declines that, with the exception of 2012, occurred annually for the last 12 years.

Private industry employers reported nearly 54,000 fewer nonfatal injury and illness cases in 2014 compared to a year earlier. Because of this decline combined with an increase in reported hours worked, the total recordable cases (TRC) incidence rate fell 0.1 cases per 100 full-time workers. The fall in the TRC rate was driven by a decline in the rate of other recordable cases, as rates for both cases involving days away from work (DAFW) and for cases of job transfer or restriction only (DJTR) were unchanged in 2014.

Please visit this link to read the full report: USDOL-BLS

NOTE: This report is provided with the understanding that the publisher is not engaged in providing legal, financial, accounting or other professional advice. If professional assistance is required, the services of a competent professional should be sought. Furthermore, while we do our best to ensure that these data are accurate, we suggest that any entity making decisions based on these numbers should verify the data at their source prior to making such decisions.

© 2015 Connecticut Human Resource Reports, LLC

URL: http://connecticuthumanresources.blogspot.com/


• U.S. Gross Domestic Product — Q3 2015

Real gross domestic product -- the value of the goods and services produced by the nation’s economy less the value of the goods and services used up in production, adjusted for price changes -- increased at an annual rate of 1.5 percent in the third quarter of 2015. In the second quarter, real GDP increased 3.9 percent.

The increase in real GDP in the third quarter primarily reflected positive contributions from personal consumption expenditures (PCE), state and local government spending, nonresidential fixed investment, exports, and residential fixed investment that were partly offset by negative contributions from private inventory investment. Imports, which are a subtraction in the calculation of GDP, increased.

Real GDP increased 1.5 percent in the third quarter, after increasing 3.9 percent in the second. The deceleration in real GDP in the third quarter primarily reflected a downturn in private inventory investment and decelerations in exports, in nonresidential fixed investment, in PCE, in state and local government spending, and in residential fixed investment that were partly offset by a deceleration in imports.

Please visit this link to read more: USDOC-BEA

NOTE: This report is provided with the understanding that the publisher is not engaged in providing legal, financial, accounting or other professional advice. If professional assistance is required, the services of a competent professional should be sought. Furthermore, while we do our best to ensure that these data are accurate, we suggest that any entity making decisions based on these numbers should verify the data at their source prior to making such decisions.

© 2015 Connecticut Human Resource Reports, LLC

URL: http://connecticuthumanresources.blogspot.com/


• U.S. Initial Unemployment Claims — 24 October 2015


In the week ending October 24, the advance figure for seasonally adjusted initial claims was 260,000, an increase of 1,000 from the previous week's unrevised level of 259,000.

The 4-week moving average was 259,250, a decrease of 4,000 from the previous week's unrevised average of 263,250.

The advance seasonally adjusted insured unemployment rate was 1.6 percent for the week ending October 17, unchanged from the previous week's unrevised rate. The advance number for seasonally adjusted insured unemployment during the week ending October 17 was 2,144,000, a decrease of 37,000 from the previous week's revised level.

The highest insured unemployment rates in the week ending October 10 were in Alaska (5.4), Puerto Rico (3.3), the Virgin Islands (2.8), New Jersey (2.3), California (2.0), Connecticut (2.0), Nevada (2.0), Pennsylvania (2.0), West Virginia (1.9), and Illinois (1.7).

The largest increases in initial claims for the week ending October 17 were in South Carolina (+2,156), Michigan (+2,117), Minnesota (+525), Vermont (+103), and Wyoming (+69), while the largest decreases were in Pennsylvania (- 3,583), Texas (-2,893), Georgia (-2,524), New York (-2,174), and Florida (-1,801).

Note: “Insured unemployment rate” refers to individuals who are unemployed and receiving UC benefits.

See the complete report at this link: USDOL-BLS

NOTE: This report is provided with the understanding that the publisher is not engaged in providing legal, financial, accounting or other professional advice. If professional assistance is required, the services of a competent professional should be sought. Furthermore, while we do our best to ensure that these data are accurate, we suggest that any entity making decisions based on these numbers should verify the data at their source prior to making such decisions.

© 2015 Connecticut Human Resource Reports, LLC

URL: http://connecticuthumanresources.blogspot.com/


28 October 2015

• U.S. Average Retail Gasoline and Diesel Fuel Prices — 26 October 2015


Regular Gasoline: The U.S. average retail regular gasoline price fell five cents from last week to $2.23 per gallon on October 26, down 83 cents per gallon from the same time last year. The Midwest price decreased seven cents to $2.23 per gallon, followed by the Gulf Coast price, which fell six cents to $1.95 per gallon. The Rocky Mountain price was down five cents to $2.30 per gallon. The East Coast price decreased four cents to $2.13 per gallon, and the West Coast price was down two cents to $2.68 per gallon.

Diesel Fuel: The U.S. average diesel fuel price decreased three cents from the previous week to $2.50 per gallon, $1.14 per gallon lower than the same time last year. The Midwest price was down six cents to $2.54 per gallon. The Gulf Coast and East Coast prices were each down three cents, to $2.30 per gallon and $2.50 per gallon, respectively. The Rocky Mountain price decreased two cents to $2.51 per gallon, while the West Coast price was down less than a penny to remain $2.70 per gallon.

Please visit this link to read the full report: USEnergyInformationAdministration

NOTE: This report is provided with the understanding that the publisher is not engaged in providing legal, financial, accounting or other professional advice. If professional assistance is required, the services of a competent professional should be sought. Furthermore, while we do our best to ensure that these data are accurate, we suggest that any entity making decisions based on these numbers should verify the data at their source prior to making such decisions.

© 2015 Connecticut Human Resource Reports, LLC

URL: http://connecticuthumanresources.blogspot.com/

• U.S. Metropolitan Area Employment and Unemployment — September 2015

• Unemployment rates were lower in September than a year earlier in 353 of the 387 metropolitan areas, higher in 25 areas, and unchanged in 9 areas. Nineteen areas had jobless rates of less than 3.0 percent, and two areas had rates of at least 10.0 percent.

• Nonfarm payroll employment increased over the year in 302 metropolitan areas, decreased in 76 areas, and was unchanged in 9 areas.

• The national unemployment rate in September was 4.9 percent, not seasonally adjusted, down from 5.7 percent a year earlier.

Please visit this link to read the full report: USDOL-BLS

NOTE: This report is provided with the understanding that the publisher is not engaged in providing legal, financial, accounting or other professional advice. If professional assistance is required, the services of a competent professional should be sought. Furthermore, while we do our best to ensure that these data are accurate, we suggest that any entity making decisions based on these numbers should verify the data at their source prior to making such decisions.

© 2015 Connecticut Human Resource Reports, LLC

URL: http://connecticuthumanresources.blogspot.com/


27 October 2015

• U.S. IRS Announces 2016 Pension Plan Limitations; 401(k) Contribution Limit Remains Unchanged at $18,000 for 2016

The highlights of limitations that changed from 2015 to 2016 include the following:

For an IRA contributor who is not covered by a workplace retirement plan and is married to someone who is covered, the deduction is phased out if the couple’s income is between $184,000 and $194,000, up from $183,000 and $193,000.

The AGI phase-out range for taxpayers making contributions to a Roth IRA is $184,000 to $194,000 for married couples filing jointly, up from $183,000 to $193,000. For singles and heads of household, the income phase-out range is $117,000 to $132,000, up from $116,000 to $131,000.

The AGI limit for the saver’s credit (also known as the retirement savings contribution credit) for low- and moderate-income workers is $61,500 for married couples filing jointly, up from $61,000; $46,125 for heads of household, up from $45,750; and $30,750 for married individuals filing separately and for singles, up from $30,500.

Please visit this link to read the full report: IR-2015-118

NOTE: This report is provided with the understanding that the publisher is not engaged in providing legal, financial, accounting or other professional advice. If professional assistance is required, the services of a competent professional should be sought. Furthermore, while we do our best to ensure that these data are accurate, we suggest that any entity making decisions based on these numbers should verify the data at their source prior to making such decisions.

© 2015 Connecticut Human Resource Reports, LLC

URL: http://connecticuthumanresources.blogspot.com/


• U.S. Business Economists Say Continued, but Slower Growth — October 2015

“• Expectations for wage increases over the next three months are lower in the current survey, indeed at their lowest level since October 2014. Forty-four percent of respondents anticipate increases in wages and salaries resulting in an NRI of 40, compared to an NRI of 47 in the previous survey.

• Survey results reflect moderating employment conditions, with the NRI slipping to its lowest level since April 2014. Roughly one-third of respondents from each sector reports rising employment during the third quarter, although the resulting NRIs by sector are quite different. Employment conditions were weakest among goods producers with 40% of respondents from this sector reporting declines for an NRI of -10.

• The share of respondents expecting their firms to increase employment in the next three months— 29%—is the smallest this year. Fourth-quarter employment growth is expected to be concentrated in the finance, insurance, real estate (FIRE) and services sectors, which have NRIs of 29 and 27, respectively. Equal shares of respondents from the goods-producing and transportation, utility, information, communication (TUIC) sectors expect rising and falling employment in their respective sectors.…”

Please visit this link to read the full report: NationalAssociationForBusinessEconomics

NOTE: This report is provided with the understanding that the publisher is not engaged in providing legal, financial, accounting or other professional advice. If professional assistance is required, the services of a competent professional should be sought. Furthermore, while we do our best to ensure that these data are accurate, we suggest that any entity making decisions based on these numbers should verify the data at their source prior to making such decisions.

© 2015 Connecticut Human Resource Reports, LLC

URL: http://connecticuthumanresources.blogspot.com/


• U.S. Consumer Confidence — October 2015

“The Conference Board Consumer Confidence Index®, which had increased moderately in September, declined in October. The Index now stands at 97.6 (1985=100), down from 102.6 in September. The Present Situation Index decreased from 120.3 last month to 112.1 in October, while the Expectations Index edged down to 88.0 from 90.8 in September.

“’Consumer confidence declined in October, following September’s modest gain,’ said Lynn Franco, Director of Economic Indicators at The Conference Board. ‘Consumers were less positive in their assessment of present-day conditions, in particular the job market, and were moderately less optimistic about the short-term outlook. Despite the decline, consumers still rate current conditions favorably, but they do not anticipate the economy strengthening much in the near-term….’”

Please visit this link to read the full report: TheConferenceBoard

NOTE: This report is provided with the understanding that the publisher is not engaged in providing legal, financial, accounting or other professional advice. If professional assistance is required, the services of a competent professional should be sought. Furthermore, while we do our best to ensure that these data are accurate, we suggest that any entity making decisions based on these numbers should verify the data at their source prior to making such decisions.

© 2015 Connecticut Human Resource Reports, LLC

URL: http://connecticuthumanresources.blogspot.com/


• U.S. Durable Goods Manufacturers’ Shipments, Inventories and Orders — September 2015

New orders for manufactured durable goods in September decreased $2.9 billion or 1.2 percent to $231.1 billion. This decrease, down two consecutive months, followed a 3.0 percent August decrease. Excluding transportation, new orders decreased 0.4 percent. Excluding defense, new orders decreased 2.0 percent.

Shipments of manufactured durable goods in September, up three of the last four months, increased $0.4 billion, or 0.2 percent, to $242.5 billion. This followed a 0.5 percent August decrease.

Inventories of manufactured durable goods in September, down four of the last five months, decreased $1.3 billion, or 0.3 percent, to $399.4 billion. This followed a 0.2 percent August decrease.

Please visit this link to read the full report: USDOCCensus

NOTE: This report is provided with the understanding that the publisher is not engaged in providing legal, financial, accounting or other professional advice. If professional assistance is required, the services of a competent professional should be sought. Furthermore, while we do our best to ensure that these data are accurate, we suggest that any entity making decisions based on these numbers should verify the data at their source prior to making such decisions.

© 2015 Connecticut Human Resource Reports, LLC

URL: http://connecticuthumanresources.blogspot.com/


• U.S. New Home Sales — September 2015

Sales of new single-family houses in September 2015 were at a seasonally adjusted annual rate of 468,000. This is 11.5 percent (±11.3%) below the revised August rate of 529,000, but is 2.0 percent (±17.9%) above the September 2014 estimate of 459,000.

The median sales price of new houses sold in September 2015 was $296,900; the average sales price was $364,100. The seasonally adjusted estimate of new houses for sale at the end of September was 225,000. This represents a supply of 5.8 months at the current sales rate.

Please visit this link to read the full report: USDOCCensus

NOTE: This report is provided with the understanding that the publisher is not engaged in providing legal, financial, accounting or other professional advice. If professional assistance is required, the services of a competent professional should be sought. Furthermore, while we do our best to ensure that these data are accurate, we suggest that any entity making decisions based on these numbers should verify the data at their source prior to making such decisions.

© 2015 Connecticut Human Resource Reports, LLC

URL: http://connecticuthumanresources.blogspot.com/


22 October 2015

• U.S. College Grads Hiring Forecast — Class of 2016

“The hiring outlook for college graduates continues to improve as employers plan to hire 11 percent more new college graduates for their U.S. operations from the Class of 2016 than they did from the Class of 2015, according to results of a new study…

”NACE’s Job Outlook 2016 survey report indicates that this is a slight bump up from last spring when employers responding to the association’s Job Outlook 2015 Spring Update survey reported an end-of-year hiring increase of almost 10 percent for Class of 2015 graduates...."

Please visit this link to read the full report: NACE

NOTE: This report is provided with the understanding that the publisher is not engaged in providing legal, financial, accounting or other professional advice. If professional assistance is required, the services of a competent professional should be sought. Furthermore, while we do our best to ensure that these data are accurate, we suggest that any entity making decisions based on these numbers should verify the data at their source prior to making such decisions.

© 2015 Connecticut Human Resource Reports, LLC

URL: http://connecticuthumanresources.blogspot.com/


• U.S. Leading Economic Index — September 2015

“The Conference Board Leading Economic Index® (LEI) for the U.S. declined 0.2 percent in September to 123.3 (2010 = 100). The Index was unchanged in August and July.

“’Despite September’s decline, the U.S. LEI still suggests economic expansion will continue, although at a moderate pace,’ said Ataman Ozyildirim, Director of Business Cycles and Growth Research at The Conference Board. ‘The recent weakness in stock markets, the manufacturing sector and housing permits was offset by gains in financial indicators, and to a lesser extent improvements in consumer expectations and initial claims for unemployment insurance. The U.S. economy is on track for moderate growth of about 2.5 percent in the coming quarters, despite the mixed global economic landscape….’”

Please visit this link to read the full report: TheConferenceBoard

NOTE: This report is provided with the understanding that the publisher is not engaged in providing legal, financial, accounting or other professional advice. If professional assistance is required, the services of a competent professional should be sought. Furthermore, while we do our best to ensure that these data are accurate, we suggest that any entity making decisions based on these numbers should verify the data at their source prior to making such decisions.

© 2015 Connecticut Human Resource Reports, LLC

URL: http://connecticuthumanresources.blogspot.com/


a

• U.S. Existing Home Sales — September 2015

“Existing–home sales rebounded strongly in September following August's decline and have now increased year–over–year for 12 consecutive months, according to the National Association of Realtors®. All four major regions experienced sales gains in September.

”Total existing–home sales1, which are completed transactions that include single–family homes, townhomes, condominiums and co–ops, increased 4.7 percent to a seasonally adjusted annual rate of 5.55 million in September from a slightly downwardly revised 5.30 million in August, and are now 8.8 percent above a year ago (5.10 million).…”

Please visit this link to read the full report: NationalAssociationRealtors

NOTE: This report is provided with the understanding that the publisher is not engaged in providing legal, financial, accounting or other professional advice. If professional assistance is required, the services of a competent professional should be sought. Furthermore, while we do our best to ensure that these data are accurate, we suggest that any entity making decisions based on these numbers should verify the data at their source prior to making such decisions.

© 2015 Connecticut Human Resource Reports, LLC

URL: http://connecticuthumanresources.blogspot.com/


• U.S. Initial Unemployment Claims — 17 October 2015


In the week ending October 17, the advance figure for seasonally adjusted initial claims was 259,000, an increase of 3,000 from the previous week's revised level. The previous week's level was revised up by 1,000 from 255,000 to 256,000.

The 4-week moving average was 263,250, a decrease of 2,000 from the previous week's revised average. This is the lowest level for this average since December 15, 1973 when it was 256,750. The previous week's average was revised up by 250 from 265,000 to 265,250.

The advance seasonally adjusted insured unemployment rate was 1.6 percent for the week ending October 10, unchanged from the previous week's unrevised rate. The advance number for seasonally adjusted insured unemployment during the week ending October 10 was 2,170,000, an increase of 6,000 from the previous week's revised level.

The highest insured unemployment rates in the week ending October 3 were in Puerto Rico (3.2), the Virgin Islands (3.0), Alaska (2.4), New Jersey (2.2), California (2.0), Connecticut (2.0), Nevada (2.0), Pennsylvania (2.0), West Virginia (1.9), Illinois (1.7), and Massachusetts (1.7).

The largest increases in initial claims for the week ending October 10 were in Texas (+2,627), New York (+2,269), Pennsylvania (+2,136), California (+1,767), and Georgia (+1,685), while the largest decreases were in Nebraska (-290), Ohio (-277), Kentucky (-101), Maine (-49), and New Jersey (-12).

Note: “Insured unemployment rate” refers to individuals who are unemployed and receiving UC benefits.

See the complete report at this link: USDOL-BLS

NOTE: This report is provided with the understanding that the publisher is not engaged in providing legal, financial, accounting or other professional advice. If professional assistance is required, the services of a competent professional should be sought. Furthermore, while we do our best to ensure that these data are accurate, we suggest that any entity making decisions based on these numbers should verify the data at their source prior to making such decisions.

© 2015 Connecticut Human Resource Reports, LLC

URL: http://connecticuthumanresources.blogspot.com/


21 October 2015

• U.S. Average Retail Gasoline and Diesel Fuel Prices — 19 October 2015


Regular Gasoline: The U.S. average retail price for regular gasoline declined six cents from last week to $2.28 per gallon on October 19, down 84 cents per gallon from the same time last year. The Midwest price fell 11 cents to $2.30 per gallon, followed by the Rocky Mountain price, which was down seven cents to $2.36 per gallon. The West Coast and Gulf Coast prices each fell five cents, to $2.70 per gallon and $2.00 per gallon, respectively. The East Coast price decreased three cents to $2.17 per gallon.

Diesel Fuel: The U.S. average diesel fuel price decreased three cents from the previous week to $2.53 per gallon, down $1.13 per gallon from the same point last year. The Rocky Mountain price posted the lone price increase, up less than one cent to remain $2.52 per gallon. The Midwest, East Coast, and West Coast prices each decreased three cents, to $2.60 per gallon, $2.52 per gallon, and $2.70 per gallon, respectively. The Gulf Coast price was down one cent to $2.33 per gallon.

Please visit this link to read the full report: USEnergyInformationAdministration

NOTE: This report is provided with the understanding that the publisher is not engaged in providing legal, financial, accounting or other professional advice. If professional assistance is required, the services of a competent professional should be sought. Furthermore, while we do our best to ensure that these data are accurate, we suggest that any entity making decisions based on these numbers should verify the data at their source prior to making such decisions.

© 2015 Connecticut Human Resource Reports, LLC

URL: http://connecticuthumanresources.blogspot.com/

20 October 2015

• U.S. Usual Weekly Earnings of Wage And Salary Workers — Q3 2015

Median weekly earnings of the nation's 110.4 million full-time wage and salary workers were $803 in the third quarter of 2015 (not seasonally adjusted). This was 1.6 percent higher than a year earlier, compared with a gain of 0.1 percent in the Consumer Price Index for All Urban Consumers (CPI-U) over the same period.

• Median weekly earnings were $803 in the third quarter of 2015. Women who usually worked full time had median weekly earnings of $721, or 81.1 percent of the $889 median for men.

• Among the major race and ethnicity groups, median earnings of Hispanics who worked full time ($602) were lower than those of blacks ($624), whites ($829), and Asians ($974). Median weekly earnings for black men working at full-time jobs were $652 per week, or 70.9 percent of the median for white men ($919). The difference was less among women, as black women's median earnings ($608) were 82.2 percent of those for white women ($740).

• By educational attainment, full-time workers age 25 and over without a high school diploma had median weekly earnings of $492, compared with $672 for high school graduates (no college) and $1,234 for those holding at least a bachelor's degree. Among college graduates with advanced degrees (professional or master's degree and above), the highest earning 10 percent of male workers made $3,480 or more per week, compared with $2,413 or more for their female counterparts.

Please visit this link to read the full report: USDOL-BLS

NOTE: This report is provided with the understanding that the publisher is not engaged in providing legal, financial, accounting or other professional advice. If professional assistance is required, the services of a competent professional should be sought. Furthermore, while we do our best to ensure that these data are accurate, we suggest that any entity making decisions based on these numbers should verify the data at their source prior to making such decisions.

© 2015 Connecticut Human Resource Reports, LLC

URL: http://connecticuthumanresources.blogspot.com/


• U.S. Regional & State Employment, Unemployment — September 2015

In September, 37 states and the District of Columbia had over-the-month unemployment rate decreases, 6 states had increases, and 7 states had no change.

Nonfarm payroll employment decreased in 27 states, increased in 20 states and the District, and was unchanged in 3 states.

Please visit this link to read the full report: USDOL-BLS

NOTE: This report is provided with the understanding that the publisher is not engaged in providing legal, financial, accounting or other professional advice. If professional assistance is required, the services of a competent professional should be sought. Furthermore, while we do our best to ensure that these data are accurate, we suggest that any entity making decisions based on these numbers should verify the data at their source prior to making such decisions.

© 2015 Connecticut Human Resource Reports, LLC

URL: http://connecticuthumanresources.blogspot.com/


• U.S. Housing Starts, New Residential Construction — September 2015

BUILDING PERMITS: Privately-owned housing units authorized by building permits in September were at a seasonally adjusted annual rate of 1,103,000. This is 5.0 percent (±1.4%) below the revised August rate of 1,161,000, but is 4.7 percent (±2.0%) above the September 2014 estimate of 1,053,000.

Single-family authorizations in September were at a rate of 697,000; this is 0.3 percent (±1.9%) below the revised August figure of 699,000. Authorizations of units in buildings with five units or more were at a rate of 369,000 in September.

HOUSING STARTS: Privately-owned housing starts in September were at a seasonally adjusted annual rate of 1,206,000. This is 6.5 percent (±16.4%) above the revised August estimate of 1,132,000 and is 17.5 percent (±18.0%)* above the September 2014 rate of 1,026,000.

Single-family housing starts in September were at a rate of 740,000; this is 0.3 percent (±9.6%)* above the revised August figure of 738,000. The September rate for units in buildings with five units or more was 454,000.

Please visit this link to read the full report: USDOCCensus

NOTE: This report is provided with the understanding that the publisher is not engaged in providing legal, financial, accounting or other professional advice. If professional assistance is required, the services of a competent professional should be sought. Furthermore, while we do our best to ensure that these data are accurate, we suggest that any entity making decisions based on these numbers should verify the data at their source prior to making such decisions.

© 2015 Connecticut Human Resource Reports, LLC

URL: http://connecticuthumanresources.blogspot.com/


16 October 2015

• U.S. Job Openings and Labor Turnover — August 2015

The number of job openings decreased to 5.4 million on the last business day of August.

The number of hires and separations was little changed at 5.1 million and 4.8 million, respectively.

Within separations, the quits rate was 1.9 percent for the fifth month in a row, and the layoffs and discharges rate was unchanged at 1.2 percent.

Please visit this link to read the full report: USDOL-BLS

NOTE: This report is provided with the understanding that the publisher is not engaged in providing legal, financial, accounting or other professional advice. If professional assistance is required, the services of a competent professional should be sought. Furthermore, while we do our best to ensure that these data are accurate, we suggest that any entity making decisions based on these numbers should verify the data at their source prior to making such decisions.

© 2015 Connecticut Human Resource Reports, LLC

URL: http://connecticuthumanresources.blogspot.com/


• U.S. Industrial Production, Capacity Utilization — September 2015

Industrial production decreased 0.2 percent in September after edging down 0.1 percent in August. The decline in August is smaller than previously reported. In September, manufacturing output moved down 0.1 percent for a second consecutive monthly decrease; the index for mining fell 2.0 percent, while the index for utilities rose 1.3 percent.

For the third quarter as a whole, total industrial production rose at an annual rate of 1.8 percent, and manufacturing output increased 2.5 percent. A strong gain for motor vehicles and parts contributed substantially to the quarterly increases. At 107.1 percent of its 2012 average, total industrial production in September was 0.4 percent above its year-earlier level.

Capacity utilization for the industrial sector fell 0.3 percentage point in September to 77.5 percent, a rate that is 2.6 percentage points below its long-run (1972–2014) average.

Please visit this link to read the full report: FederalReserve

NOTE: This report is provided with the understanding that the publisher is not engaged in providing legal, financial, accounting or other professional advice. If professional assistance is required, the services of a competent professional should be sought. Furthermore, while we do our best to ensure that these data are accurate, we suggest that any entity making decisions based on these numbers should verify the data at their source prior to making such decisions.

© 2015 Connecticut Human Resource Reports, LLC

URL: http://connecticuthumanresources.blogspot.com/


15 October 2015

• U.S. Average Retail Gasoline and Diesel Fuel Prices — 12 October 2015


• U.S. Average Retail Gasoline and Diesel Fuel Prices — 12 October 2015

Regular Gasoline: The U.S. average regular gasoline retail price increased two cents from the previous week to $2.34 per gallon on October 12, 2015, 87 cents per gallon lower than at the same time last year. The Rocky Mountain and West Coast prices both decreased, by five cents and four cents respectively, to $2.42 per gallon and $2.75 per gallon, respectively. The Midwest price increased five cents to $2.41 per gallon. The East Coast and Gulf Coast prices both increased two cents, to $2.19 per gallon and $2.05 per gallon, respectively.

Diesel Fuel: The U.S. average diesel fuel price increased six cents from last week to $2.56 per gallon, down $1.14 per gallon from the same time last year. The Midwest price increased 15 cents to $2.63 per gallon, supported by widespread refinery maintenance and harvest demand. The West Coast price increased four cents to $2.73 per gallon, while the East Coast price was up three cents to $2.55 per gallon. The Gulf Coast and Rocky Mountain prices each increased two cents, to $2.34 per gallon and $2.52 per gallon, respectively.

Please visit this link to read the full report: USEnergyInformationAdministration

NOTE: This report is provided with the understanding that the publisher is not engaged in providing legal, financial, accounting or other professional advice. If professional assistance is required, the services of a competent professional should be sought. Furthermore, while we do our best to ensure that these data are accurate, we suggest that any entity making decisions based on these numbers should verify the data at their source prior to making such decisions.

© 2015 Connecticut Human Resource Reports, LLC

URL: http://connecticuthumanresources.blogspot.com/

• U.S. Real Earnings – September 2015


For the Month: Real average hourly earnings for all employees increased 0.1 percent from August to September, seasonally adjusted. This result stems from essentially no change in average hourly earnings combined with a 0.2-percent decrease in the Consumer Price Index for All Urban Consumers (CPI-U).

Real average weekly earnings decreased 0.2 percent over the month due to the increase in real average hourly earnings being more than offset by a decrease of 0.3 percent in the average workweek.

For the Year: Real average hourly earnings increased 2.2 percent, seasonally adjusted, from September 2014 to September 2015. This increase in real average hourly earnings combined with no change in the average workweek resulted in a 2.2-percent increase in real average weekly earnings over this period.

Please visit this link to read the full report: USDOL-BLS

*Note: Real earnings show the effect of inflation on your pay. If your salary went up by 2.1% over the year while the cost-of-living (CPI-U) rose 2.3%, then the “real” value of your salary fell by 0.2% [differences in some of the data are due to rounding and seasonal adjustment]. The figures reported here are earnings for all employees on private nonfarm payrolls, seasonally adjusted.

NOTE: This report is provided with the understanding that the publisher is not engaged in providing legal, financial, accounting or other professional advice. If professional assistance is required, the services of a competent professional should be sought. Furthermore, while we do our best to ensure that these data are accurate, we suggest that any entity making decisions based on these numbers should verify the data at their source prior to making such decisions.

© 2015 Connecticut Human Resource Reports, LLC

URL: http://connecticuthumanresources.blogspot.com/


• U.S. Initial Unemployment Claims — 10 October 2015


In the week ending October 10, the advance figure for seasonally adjusted initial claims was 255,000, a decrease of 7,000 from the previous week's revised level. The previous week's level was revised down by 1,000 from 263,000 to 262,000.

The 4-week moving average was 265,000, a decrease of 2,250 from the previous week's revised average. This is the lowest level for this average since December 15, 1973 when it was 256,750. The previous week's average was revised down by 250 from 267,500 to 267,250.

The advance seasonally adjusted insured unemployment rate was 1.6 percent for the week ending October 3, unchanged from the previous week's unrevised rate. The advance number for seasonally adjusted insured unemployment during the week ending October 3 was 2,158,000, a decrease of 50,000 from the previous week's revised level.

The highest insured unemployment rates in the week ending September 26 were in Puerto Rico (3.4), the Virgin Islands (2.9), Alaska (2.5), New Jersey (2.3), Nevada (2.2), California (2.1), Pennsylvania (2.1), Connecticut (2.0), Illinois (1.8), and West Virginia (1.8).

The largest increases in initial claims for the week ending October 3 were in Pennsylvania (+2,548), California (+2,351), Texas (+1,323), Georgia (+1,235), and Arizona (+722), while the largest decreases were in Michigan (-2,436), New York (-1,614), Nevada (-439), Puerto Rico (-242), and Oregon (-172).

Note: “Insured unemployment rate” refers to individuals who are unemployed and receiving UC benefits.

See the complete report at this link: USDOL-BLS

NOTE: This report is provided with the understanding that the publisher is not engaged in providing legal, financial, accounting or other professional advice. If professional assistance is required, the services of a competent professional should be sought. Furthermore, while we do our best to ensure that these data are accurate, we suggest that any entity making decisions based on these numbers should verify the data at their source prior to making such decisions.

© 2015 Connecticut Human Resource Reports, LLC

URL: http://connecticuthumanresources.blogspot.com/


• U.S. Consumer Price Indexes — September 2015

CPI-U: The Consumer Price Index for All Urban Consumers (CPI-U) was essentially unchanged over the last 12 months; the September index level is 237.945 (1982-84=100). For the month, the index declined 0.2 percent prior to seasonal adjustment.

CPI-W: The Consumer Price Index for Urban Wage Earners and Clerical Workers (CPI-W) decreased 0.6 percent over the last 12 months to an index level of 232.661 (1982-84=100). For the month, the index declined 0.3 percent prior to seasonal adjustment.

C-CPI-U: The Chained Consumer Price Index for All Urban Consumers (C-CPI-U) decreased 0.5 percent over the last 12 months. For the month, the index declined 0.3 percent on a not seasonally adjusted basis. Please note that the indexes for the past 10 to 12 months are subject to revision.

The Consumer Price Index for October 2015 is scheduled to be released on Tuesday, November 17, at 8:30 a.m. (EST).

Please visit this link to read the full report: USDOL-BLS

NOTE: This report is provided with the understanding that the publisher is not engaged in providing legal, financial, accounting or other professional advice. If professional assistance is required, the services of a competent professional should be sought. Furthermore, while we do our best to ensure that these data are accurate, we suggest that any entity making decisions based on these numbers should verify the data at their source prior to making such decisions.

© 2015 Connecticut Human Resource Reports, LLC

URL: http://connecticuthumanresources.blogspot.com/


• U.S. Law Does Not Provide for a Social Security Cost-of-Living Adjustment — 2016

With consumer prices down over the past year, monthly Social Security and Supplemental Security Income (SSI) benefits for nearly 65 million Americans will not automatically increase in 2016.

The Social Security Act provides for an automatic increase in Social Security and SSI benefits if there is an increase in inflation as measured by the Consumer Price Index for Urban Wage Earners and Clerical Workers (CPI-W). The period of consideration includes the third quarter of the last year a cost-of-living adjustment (COLA) was made to the third quarter of the current year. As determined by the Bureau of Labor Statistics, there was no increase in the CPI-W from the third quarter of 2014 to the third quarter of 2015. Therefore, under existing law, there can be no COLA in 2016.

Please visit this link to read the full report: SSA.gov

NOTE: This report is provided with the understanding that the publisher is not engaged in providing legal, financial, accounting or other professional advice. If professional assistance is required, the services of a competent professional should be sought. Furthermore, while we do our best to ensure that these data are accurate, we suggest that any entity making decisions based on these numbers should verify the data at their source prior to making such decisions.

© 2015 Connecticut Human Resource Reports, LLC

URL: http://connecticuthumanresources.blogspot.com/


14 October 2015

• U.S. Manufacturers’ Sales, Inventories — August 2015

Sales. The combined value of distributive trade sales and manufacturers’ shipments for August, adjusted for seasonal and trading-day differences but not for price changes, was estimated at $1,320.5 billion, down 0.6 percent (±0.2%) from July 2015 and was down 3.1 percent (±0.5%) from August 2014.

Inventories. Manufacturers’ and trade inventories, adjusted for seasonal variations but not for price changes, were estimated at an end-of-month level of $1,811.0 billion, virtually unchanged (±0.1%) from July 2015, but were up 2.4 percent (±0.5%) from August 2014.

Inventories/Sales Ratio. The total b

Please visit this link to read the full report: USDOCCensus

NOTE: This report is provided with the understanding that the publisher is not engaged in providing legal, financial, accounting or other professional advice. If professional assistance is required, the services of a competent professional should be sought. Furthermore, while we do our best to ensure that these data are accurate, we suggest that any entity making decisions based on these numbers should verify the data at their source prior to making such decisions.

© 2015 Connecticut Human Resource Reports, LLC

URL: http://connecticuthumanresources.blogspot.com/


• U.S. Retail Sales — September 2015

U.S. retail and food services sales for September, adjusted for seasonal variation and holiday and trading-day differences, but not for price changes, were $447.7 billion, an increase of 0.1 percent (±0.5%) from the previous month, and 2.4 percent (±0.7%) above September 2014.

Total sales for the July 2015 through September 2015 period were up 2.3 percent (±0.5%) from the same period a year ago. The July 2015 to August 2015 percent change was revised from +0.2 percent (±0.5%) to virtually unchanged…. (±0.2%)*

Please visit this link to read the full report: USDOCCensus

NOTE: This report is provided with the understanding that the publisher is not engaged in providing legal, financial, accounting or other professional advice. If professional assistance is required, the services of a competent professional should be sought. Furthermore, while we do our best to ensure that these data are accurate, we suggest that any entity making decisions based on these numbers should verify the data at their source prior to making such decisions.

© 2015 Connecticut Human Resource Reports, LLC

URL: http://connecticuthumanresources.blogspot.com/


• U.S. Projected Salary Increases…Another Look — 2016

“While recent pay surveys have projected that 2016 salaries will be budgeted to increase around 3 percent, the newly released 2016 Salary Guide from talent acquisition firm Adecco Staffing USA suggests that those predictions may be skewed upward.…”

Please visit this link to read the full report: SHRM

NOTE: This report is provided with the understanding that the publisher is not engaged in providing legal, financial, accounting or other professional advice. If professional assistance is required, the services of a competent professional should be sought. Furthermore, while we do our best to ensure that these data are accurate, we suggest that any entity making decisions based on these numbers should verify the data at their source prior to making such decisions.

© 2015 Connecticut Human Resource Reports, LLC

URL: http://connecticuthumanresources.blogspot.com/


• U.S. Projected Salary Increase Budgets — 2016

“For the fifth year in a row, U.S. employees can expect to see a moderate 3.0% median base salary increase in 2016, according to new research released by Hay Group, the global management consulting firm.

”This figure is in line with actual pay increases of 3.0% reported by the surveyed companies in 2015.…”

Please visit this link to read the full report: HayGroup

NOTE: This report is provided with the understanding that the publisher is not engaged in providing legal, financial, accounting or other professional advice. If professional assistance is required, the services of a competent professional should be sought. Furthermore, while we do our best to ensure that these data are accurate, we suggest that any entity making decisions based on these numbers should verify the data at their source prior to making such decisions.

© 2015 Connecticut Human Resource Reports, LLC

URL: http://connecticuthumanresources.blogspot.com/


• U.S. Producer Price Index PPI for Final Demand Decreases 0.5% — September 2015

The Producer Price Index for final demand declined 0.5 percent in September. Final demand prices were unchanged in August and rose 0.2 percent in July.

In September, prices for final demand goods fell 1.2 percent and the index for final demand services decreased 0.4 percent.

Please visit this link to read the full report: USDOL-BLS

NOTE: This report is provided with the understanding that the publisher is not engaged in providing legal, financial, accounting or other professional advice. If professional assistance is required, the services of a competent professional should be sought. Furthermore, while we do our best to ensure that these data are accurate, we suggest that any entity making decisions based on these numbers should verify the data at their source prior to making such decisions.

© 2015 Connecticut Human Resource Reports, LLC

URL: http://connecticuthumanresources.blogspot.com/


13 October 2015

• U.S. Business Economists Job-Creation, Unemployment Forecast — October 2015

“The survey results reveal expectations for a slowing—but still robust—pace of job creation. The median forecast for nonfarm payroll employment growth in both 2015 and 2016 is an increase of just over 210,000 per month, similar to June’s forecast. Payrolls grew at a 260,000 monthly clip in 2014.

”Unemployment rate expectations are slightly improved compared to those expressed in June; the unemployment rate is expected to fall to 5.1% on average during the fourth quarter of 2015 and to 4.8% on average during the fourth quarter of 2016.…”

Please visit this link to read the full report: NationalAssociationForBusinessEconomics

NOTE: This report is provided with the understanding that the publisher is not engaged in providing legal, financial, accounting or other professional advice. If professional assistance is required, the services of a competent professional should be sought. Furthermore, while we do our best to ensure that these data are accurate, we suggest that any entity making decisions based on these numbers should verify the data at their source prior to making such decisions.

© 2015 Connecticut Human Resource Reports, LLC

URL: http://connecticuthumanresources.blogspot.com/


09 October 2015

• U.S. Monthly Wholesale Trade: Sales and Inventories — August 2015

August 2015 sales of merchant wholesalers, except manufacturers’ sales branches and offices, after adjustment for seasonal variations and trading-day differences but not for price changes, were $445.4 billion, down 1.0 percent (+/-0.7%) from the revised July level and were down 4.7 percent (+/-1.6%) from the August 2014 level.

Please visit this link to read the full report: USDOCCensus

NOTE: This report is provided with the understanding that the publisher is not engaged in providing legal, financial, accounting or other professional advice. If professional assistance is required, the services of a competent professional should be sought. Furthermore, while we do our best to ensure that these data are accurate, we suggest that any entity making decisions based on these numbers should verify the data at their source prior to making such decisions.

© 2015 Connecticut Human Resource Reports, LLC

URL: http://connecticuthumanresources.blogspot.com/


08 October 2015

• U.S. Initial Unemployment Claims — 03 October 2015


In the week ending October 3, the advance figure for seasonally adjusted initial claims was 263,000, a decrease of 13,000 from the previous week's revised level. The previous week's level was revised down by 1,000 from 277,000 to 276,000. The 4-week moving average was 267,500, a decrease of 3,000 from the previous week's revised average. The previous week's average was revised down by 250 from 270,750 to 270,500.

The advance seasonally adjusted insured unemployment rate was 1.6 percent for the week ending September 26, unchanged from the previous week's unrevised rate. The advance number for seasonally adjusted insured unemployment during the week ending September 26 was 2,204,000, an increase of 9,000 from the previous week's revised level.

The highest insured unemployment rates in the week ending September 19 were in Puerto Rico (3.2), the Virgin Islands (3.0), Alaska (2.3), New Jersey (2.3), California (2.2), Nevada (2.2), Connecticut (2.0), Pennsylvania (2.0), West Virginia (1.8), Illinois (1.7), and Massachusetts.

The largest increases in initial claims for the week ending September 26 were in Michigan (+2,837), Illinois (+871), New York (+708), New Jersey (+558), and Puerto Rico (+194), while the largest decreases were in Kansas (-2,588), Georgia (-868), South Carolina (-789), Missouri (-524), and Texas (-501).

Note: “Insured unemployment rate” refers to individuals who are unemployed and receiving UC benefits.

See the complete report at this link: USDOL-BLS

NOTE: This report is provided with the understanding that the publisher is not engaged in providing legal, financial, accounting or other professional advice. If professional assistance is required, the services of a competent professional should be sought. Furthermore, while we do our best to ensure that these data are accurate, we suggest that any entity making decisions based on these numbers should verify the data at their source prior to making such decisions.

© 2015 Connecticut Human Resource Reports, LLC

URL: http://connecticuthumanresources.blogspot.com/


07 October 2015

• U.S. Average Retail Gasoline and Diesel Fuel Prices — 05 October 2015


Regular Gasoline: The U.S. average retail price of regular gasoline decreased less than a penny from the previous week to remain $2.32 per gallon on October 5, 2015, 98 cents per gallon lower than the same time last year. The Midwest and Gulf Coast prices increased three cents and two cents, respectively, to $2.35 per gallon and $2.04 per gallon, respectively. The Rocky Mountain price decreased six cents to $2.48 per gallon, while the West Coast price fell five cents to $2.79 per gallon. The East Coast price was down one cent to $2.17 per gallon.

Diesel Fuel: The U.S. average diesel fuel price increased two cents from the week prior to $2.49 per gallon, $1.24 per gallon less than at the same time last year. The Midwest price increased six cents to $2.49 per gallon. The Rocky Mountain price increased two cents to $2.50 per gallon, and the West Coast price increased less than a penny to remain $2.69 per gallon. The Gulf Coast price was unchanged from the previous week and remained $2.32 per gallon. The East Coast price was down one cent to $2.52 per gallon.<

Please visit this link to read the full report: USEnergyInformationAdministration

NOTE: This report is provided with the understanding that the publisher is not engaged in providing legal, financial, accounting or other professional advice. If professional assistance is required, the services of a competent professional should be sought. Furthermore, while we do our best to ensure that these data are accurate, we suggest that any entity making decisions based on these numbers should verify the data at their source prior to making such decisions.

© 2015 Connecticut Human Resource Reports, LLC

URL: http://connecticuthumanresources.blogspot.com/

06 October 2015

• U.S. Trade Deficit — August 2015

The goods and services deficit was $48.3 billion in August, up $6.5 billion from $41.8 billion in July, revised. August exports were $185.1 billion, $3.7 billion less than July exports. August imports were $233.4 billion, $2.8 billion more than July imports.

The August increase in the goods and services deficit reflected an increase in the goods deficit of $6.6 billion to $67.9 billion and an increase in the services surplus of $0.1 billion to $19.6 billion.

Year-to-date, the goods and services deficit increased $17.6 billion, or 5.2 percent, from the same period in 2014. Exports decreased $58.9 billion or 3.8 percent. Imports decreased $41.3 billion or 2.2 percent.

Please visit this link to read the full report: USDOC-BEA

NOTE: This report is provided with the understanding that the publisher is not engaged in providing legal, financial, accounting or other professional advice. If professional assistance is required, the services of a competent professional should be sought. Furthermore, while we do our best to ensure that these data are accurate, we suggest that any entity making decisions based on these numbers should verify the data at their source prior to making such decisions.

© 2015 Connecticut Human Resource Reports, LLC

URL: http://connecticuthumanresources.blogspot.com/


05 October 2015

• U.S. Labor Market Conditions Index — September 2015


Supposedly, values above zero indicate an improving labor market and values below zero indicate a deteriorating labor market.

Please visit this link to read the full report: Federal Reserve

Fed: “The LMCI is derived from a dynamic factor model that extracts the primary common variation from 19, seasonally-adjusted, labor market indicators. Users can read about the included indicators at: Federal Reserve Information on the LMCI. Users of the LMCI should take note that the entire history of the LMCI may revise each month….”

The Wall Street Journal says, “The labor market conditions index is by definition an index. Higher index numbers are positives and vice versa. The report focuses on the change in the index—how strong a plus change or a negative change. Plus indicates improving labor market conditions. But there is extreme detail with 19 components. Subcomponent detail can be important, depending on how many components are positive versus those that are negative or sluggish. A key feature of this report is that it pulls together many labor market indicators into one place.”

NOTE: This report is provided with the understanding that the publisher is not engaged in providing legal, financial, accounting or other professional advice. If professional assistance is required, the services of a competent professional should be sought. Furthermore, while we do our best to ensure that these data are accurate, we suggest that any entity making decisions based on these numbers should verify the data at their source prior to making such decisions.

© 2015 Connecticut Human Resource Reports, LLC

URL: http://connecticuthumanresources.blogspot.com/


02 October 2015

• U.S. Full Report on Manufacturers’ Shipments, Inventories, and Orders — August 2015

New orders for manufactured goods in August, down following two consecutive monthly increases, decreased $8.2 billion or 1.7 percent to $473.0 billion. This followed a 0.2 percent July increase.

Shipments, down four of the last five months, decreased $3.2 billion or 0.7 percent to $480.1 billion. This followed a 0.2 percent July decrease.

Inventories, down two consecutive months, decreased $1.6 billion or 0.3 percent to $648.4 billion. This followed a 0.3 percent July decrease. The inventories

Please visit this link to read the full report: USDOCCensus

NOTE: This report is provided with the understanding that the publisher is not engaged in providing legal, financial, accounting or other professional advice. If professional assistance is required, the services of a competent professional should be sought. Furthermore, while we do our best to ensure that these data are accurate, we suggest that any entity making decisions based on these numbers should verify the data at their source prior to making such decisions.

© 2015 Connecticut Human Resource Reports, LLC

URL: http://connecticuthumanresources.blogspot.com/


• U.S. Employment Situation — September 2015

Total nonfarm payroll employment increased by 142,000 in September, and the unemployment rate was unchanged at 5.1 percent. Job gains occurred in health care and information, while mining employment fell.

The unemployment rate held at 5.1 percent, and the number of unemployed persons (7.9 million) changed little. Over the year, the unemployment rate and the number of unemployed persons were down by 0.8 percentage point and 1.3 million, respectively.

Among the major worker groups, the unemployment rates for adult men (4.7 percent), adult women (4.6 percent), teenagers (16.3 percent), whites (4.4 percent), blacks (9.2 percent), Asians (3.6 percent), and Hispanics (6.4 percent) showed little or no change in September.

Please visit this link to read the full report: USDOL-BLS

NOTE: This report is provided with the understanding that the publisher is not engaged in providing legal, financial, accounting or other professional advice. If professional assistance is required, the services of a competent professional should be sought. Furthermore, while we do our best to ensure that these data are accurate, we suggest that any entity making decisions based on these numbers should verify the data at their source prior to making such decisions.

© 2015 Connecticut Human Resource Reports, LLC

URL: http://connecticuthumanresources.blogspot.com/


01 October 2015

• U.S. “Class of 2015: Students’ Post-Graduation Plans Hint at Improving Job Market”

“Although the movements are slight, the Class of 2015’s post-graduation plans reflect a gradual improvement in the college hiring market as nearly 61 percent of graduates plan to enter the work force, according to a recent report from the National Association of Colleges and Employers (NACE).

”The plans that graduating seniors have tend to be reflective of the state of the college hiring market. When students perceive the market to be healthy, they are more are likely to enter the work force immediately after graduation. Conversely, when they perceive the market to be weaker, the percentage planning to immediately go on to graduate school increases….”

Please visit this link to read the full report: NACE

NOTE: This report is provided with the understanding that the publisher is not engaged in providing legal, financial, accounting or other professional advice. If professional assistance is required, the services of a competent professional should be sought. Furthermore, while we do our best to ensure that these data are accurate, we suggest that any entity making decisions based on these numbers should verify the data at their source prior to making such decisions.

© 2015 Connecticut Human Resource Reports, LLC

URL: http://connecticuthumanresources.blogspot.com/


• U.S. Construction Spending — August 2015

Construction spending during August 2015 was estimated at a seasonally adjusted annual rate of $1,086.2 billion, 0.7 percent (±1.5%) above the revised July estimate of $1,079.1 billion. The August figure is 13.7 percent (±2.1%) above the August 2014 estimate of $955.0 billion.

During the first 8 months of this year, construction spending amounted to $683.4 billion, 9.8 percent (±1.3%) above the $622.4 billion for the same period in 2014.

Please visit this link to read the full report: USDOC-Census

NOTE: This report is provided with the understanding that the publisher is not engaged in providing legal, financial, accounting or other professional advice. If professional assistance is required, the services of a competent professional should be sought. Furthermore, while we do our best to ensure that these data are accurate, we suggest that any entity making decisions based on these numbers should verify the data at their source prior to making such decisions.

© 2015 Connecticut Human Resource Reports, LLC

URL: http://connecticuthumanresources.blogspot.com/


• U.S. ISM Manufacturing Report — September 2015

“Economic activity in the manufacturing sector expanded in September for the 33rd consecutive month, and the overall economy grew for the 76th consecutive month, say the nation’s supply executives in the latest Manufacturing ISM® Report On Business®.

"The September PMI® registered 50.2 percent, a decrease of 0.9 percentage point from the August reading of 51.1 percent….”

Please visit this link to read the full report: InstituteForSupplyManagement

NOTE: This report is provided with the understanding that the publisher is not engaged in providing legal, financial, accounting or other professional advice. If professional assistance is required, the services of a competent professional should be sought. Furthermore, while we do our best to ensure that these data are accurate, we suggest that any entity making decisions based on these numbers should verify the data at their source prior to making such decisions.

© 2015 Connecticut Human Resource Reports, LLC

URL: http://connecticuthumanresources.blogspot.com/


• U.S. Initial Unemployment Claims — 26 September 2015


In the week ending September 26, the advance figure for seasonally adjusted initial claims was 277,000, an increase of 10,000 from the previous week's unrevised level of 267,000.

The 4-week moving average was 270,750, a decrease of 1,000 from the previous week's unrevised average of 271,750.

The advance seasonally adjusted insured unemployment rate was 1.6 percent for the week ending September 19, a decrease of 0.1 percentage point from the previous week's unrevised rate. The advance number for seasonally adjusted insured unemployment during the week ending September 19 was 2,191,000, a decrease of 53,000 from the previous week's revised level.

The highest insured unemployment rates in the week ending September 12 were in Puerto Rico (3.4), the Virgin Islands (2.7), New Jersey (2.5), Alaska (2.4), California (2.2), Nevada (2.2), Pennsylvania (2.2), Connecticut (2.0), Illinois (1.9), and West Virginia (1.9).

The largest increases in initial claims for the week ending September 19 were in California (+3,725), Kansas (+2,739), Texas (+2,185), New York (+1,878), and Missouri (+960), while the largest decreases were in Wisconsin (-278), North Dakota (-180), Rhode Island (-129), Minnesota (-101), and Kentucky (-78).

Note: “Insured unemployment rate” refers to individuals who are unemployed and receiving UC benefits.

See the complete report at this link: USDOL-BLS

NOTE: This report is provided with the understanding that the publisher is not engaged in providing legal, financial, accounting or other professional advice. If professional assistance is required, the services of a competent professional should be sought. Furthermore, while we do our best to ensure that these data are accurate, we suggest that any entity making decisions based on these numbers should verify the data at their source prior to making such decisions.

© 2015 Connecticut Human Resource Reports, LLC

URL: http://connecticuthumanresources.blogspot.com/