In the week ending December 21, the advance figure for seasonally adjusted initial claims was 338,000, a decrease of 42,000 from the previous week's revised figure of 380,000.  The advance seasonally adjusted insured unemployment rate was 2.2 percent for the week ending December 14, unchanged from the prior week's unrevised rate. The highest insured unemployment rates in the week ending December 14 were in Alaska (5.3), Puerto Rico (3.8), Pennsylvania (3.5), California (3.3), Connecticut (3.1), Montana (3.1), West Virginia (3.1), Illinois (2.8), Oregon (2.8), and Wisconsin (2.8). The largest increases in initial claims for the week ending December 14 were in California (+4,622), Illinois (+3,686), Massachusetts (+2,331), Ohio (+1,529), and Indiana (+1,473), while the largest decreases were in New York (-12,706), Pennsylvania (-10,866), Georgia (-8,340), Texas (-4,904), and Wisconsin (-4,821). Click on chart to enlarge Note: “Insured unemployment rate” refers to individuals who are unemployed and receiving UC benefits. See the complete report at this link: USDOL-BLS |
26 December 2013
• U.S. Initial Unemployment Claims – 21 December 2013
23 December 2013
• U.S. Personal Income And Outlays - November 2013
 Personal consumption expenditures (PCE) increased $63.0 billion, or 0.5 percent. In October, personal income decreased $11.7 billion, or 0.1 percent, DPI decreased $25.6 billion, or 0.2 percent, and PCE increased $44.2 billion, or 0.4 percent, based on revised estimates. Real disposable personal income increased 0.1 percent in November, in contrast to a decrease of 0.2 percent in October. Real PCE increased 0.5 percent in November, compared with an increase of 0.4 percent in October. See the complete report at this link: USDOC-BEA |
• U.S. Payrolls – November 2013
Private wages and salaries increased $26.1 billion in November, compared with an increase of $9.9 billion in October.
 Services-producing industries' payrolls increased $17.8 billion, compared with an increase of $8.6 billion. Government wages and salaries increased $1.0 billion, in contrast to a decrease of $0.1 billion. See the complete report at this link: USDOC-BEA |
20 December 2013
• U.S. Regional and State Employment and Unemployment -- November 2013
|
UNEMPLOYMENT
Regional and state unemployment rates were generally lower in November. Forty-five states and the District of Columbia had unemployment rate decreases from October and five states had no change. Forty-two states had unemployment rate decreases from a year earlier, seven states and the District of Columbia had increases, and one state had no change.  14 states had statistically significant over-the-month changes in employment, all of which were increases. The largest statistically significant job gains occurred in California (+44,300), Texas (+28,700), and Indiana (+25,200). Over the year, 33 states had statistically significant changes in employment, all of which were positive. The largest over-the-year job increase occurred in Texas (+274,200), followed by California (+226,200) and Florida (+183,100). See the complete report at this link: USDOL-BLS |
• U.S. GDP 3rd Estimate – Q3 2013
Real gross domestic product -- the output of goods and services produced by labor and property
located in the United States -- increased at an annual rate of 4.1 percent in the third quarter of 2013 (that
is, from the second quarter to the third quarter), according to the "third" estimate released by the Bureau
of Economic Analysis. In the second quarter, real GDP increased 2.5 percent.
 The increase in real GDP in the third quarter primarily reflected positive contributions from private inventory investment, PCE, nonresidential fixed investment, exports, residential fixed investment, and state and local government spending that were partly offset by a negative contribution from federal government spending. Imports, which are a subtraction in the calculation of GDP, increased. The acceleration in real GDP growth in the third quarter primarily reflected an acceleration in private inventory investment, a deceleration in imports, and accelerations in state and local government spending and in PCE that were partly offset by a deceleration in exports. See the complete report at this link: USDOC-BEA |
19 December 2013
• U.S. Personal Income by State – September 2013
State personal income growth slowed slightly to 1.1 percent in the third quarter of 2013, from 1.2 percent in the second quarter.
 The national price index for personal consumption expenditures increased 0.5 percent in the third quarter after remaining unchanged in the second quarter. See the complete report at this link: USDOC-BEA |
• U.S. Employment Projections: 2012-2022
| Occupations and industries related to healthcare are projected to add
the most new jobs between 2012 and 2022.
Total employment is projected to increase 10.8 percent, or 15.6 million, during the decade.  See the complete report at this link: USDOL-BLS |
• U.S. Initial Unemployment Claims – 14 December 2013
[Jobless]
In the week ending December 14, the advance figure for seasonally adjusted initial claims was 379,000, an increase of 10,000 from the previous week's figure of 369,000.  The advance seasonally adjusted insured unemployment rate was 2.2 percent for the week ending December 7, an increase of 0.1 percentage point from the prior week's unrevised rate. The highest insured unemployment rates in the week ending December 7 were in Alaska (6.0), Puerto Rico (3.6), New Jersey (3.5), California (3.4), Connecticut (3.1), Pennsylvania (3.1), West Virginia (3.0), Wisconsin (3.0), Montana (2.9), and Oregon (2.9). The largest increases in initial claims for the week ending December 7 were in California (+21,876), New York (+14,322), Pennsylvania (+14,004), Georgia (+11,582), and Texas (+9,761), while the largest decreases were in Ohio (-1,095), Kentucky (-838), Vermont (-400), Massachusetts (-317), and New Mexico (-176). Click on chart to enlarge Note: “Insured unemployment rate” refers to individuals who are unemployed and receiving UC benefits. See the complete report at this link: USDOL-BLS |
18 December 2013
• U.S. Employment and Wages, by County – Q2 2013
 Atlantic, N.J., had the largest over-the-year decrease in employment among the largest counties in the U.S. with a loss of 4.5 percent. The U.S. average weekly wage increased over the year by 2.1 percent to $921 in the second quarter of 2013. Union, N.J., had the largest over-the-year increase in average weekly wages with a gain of 8.1 percent. Davidson, Tenn., experienced the largest decrease in average weekly wages with a loss of 2.2 percent over the year. See the complete report at this link: USDOL-BLS |
17 December 2013
• U.S. Real Earnings – November 2013
 Real average weekly earnings rose 0.4 percent over the month due to the increase in real average hourly earnings combined with a 0.3 percent increase in the average workweek. Real average hourly earnings rose 0.9 percent, seasonally adjusted, from November 2012 to November 2013. The increase in real average hourly earnings, combined with a 0.3 percent increase in the average workweek, resulted in a 1.1 percent increase in real average weekly earnings over this period. See the complete report at this link: USDOL-BLS *Note: Real earnings show the effect of inflation on your pay. If your salary went up by 1.1% over the year while the cost-of-living (CPI-U) rose 1.3%, then the “real” value of your salary fell by 0.2% [differences in some of the data are due to rounding and seasonal adjustment]. The figures reported here are earnings for all employees on private nonfarm payrolls, seasonally adjusted. |
• U.S. Consumer Price Index – November 2013
| The Consumer Price Index for All Urban Consumers (CPI-U) was
unchanged in November on a seasonally adjusted basis. Over the last 12 months, the all
items index increased 1.2 percent before seasonal adjustment.
Not seasonally adjusted data: CPI-U: The Consumer Price Index for All Urban Consumers (CPI-U) increased 1.2 percent over the last 12 months to an index level of 233.069 (1982-84=100). For the month, the index decreased 0.2 percent prior to seasonal adjustment.  Click on chart to enlarge C-CPI-U: The Chained Consumer Price Index for All Urban Consumers (C-CPI-U) increased 1.1 percent over the last 12 months to an index level of 133.724. For the month, the index decreased 0.2 percent on a not seasonally adjusted basis. Please note that the indexes for the post-2011 period are subject to revision. The Consumer Price Index for December 2013 is scheduled to be released on Thursday, January 16, 2014, at 8:30 a.m. (EST). See the complete report at this link: USDOL-BLS |
16 December 2013
• Minimum Wage Increases by State – Effective 01 January 2014
 See the complete report at this link: JacksonLewis.com |
• U.S. Labor Productivity and Unit Labor Costs – Q3 2013 [Revised]
The measures released today are based on more recent source data than were
available for the preliminary report.
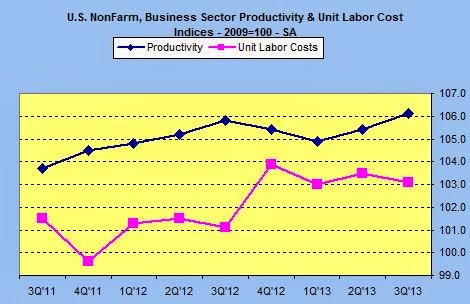  Click on charts to enlarge Manufacturing sector productivity declined 0.1 percent in the third quarter of 2013, as output and hours worked increased 1.1 percent and 1.2 percent, respectively. See the complete report at this link: USDOL-BLS |
13 December 2013
• U.S. Producer Price Index – November 2013
 At the earlier stages of processing, prices received by manufacturers of intermediate goods declined 0.5 percent, and the crude goods index fell 2.6 percent. On an unadjusted basis, prices for finished goods advanced 0.7 percent for the 12 months ended November 2013. See the complete report at this link: USDOL-BLS |
12 December 2013
• U.S. Initial Unemployment Claims – 07 December 2013
[Jobless]
In the week ending December 7, the advance figure for seasonally adjusted initial claims was 368,000, an increase of 68,000 from the previous week's revised figure of 300,000.  The advance seasonally adjusted insured unemployment rate was 2.1 percent for the week ending November 30, unchanged from the prior week's unrevised rate. The highest insured unemployment rates in the week ending November 30 were in Alaska (5.0), Puerto Rico (3.6), New Jersey (3.1), Connecticut (2.8), Pennsylvania (2.7), Virgin Islands (2.7), Montana (2.6), Oregon (2.6), Nevada (2.5), Rhode Island (2.5), California (2.4), and Illinois (2.4). The largest increases in initial claims for the week ending November 30 were in Wisconsin (+4,420), Ohio (+2,597), Kentucky (+1,538), Massachusetts (+1,129), and New Jersey (+1,124), while the largest decreases were in California (-19,920), Texas (-7,284), Florida (-5,400), Pennsylvania (-5,145), and Nevada (-3,295). Click on chart to enlarge Note: “Insured unemployment rate” refers to individuals who are unemployed and receiving UC benefits. See the complete report at this link: USDOL-BLS |
11 December 2013
• Employer Costs for Employee Compensation – Q3 2013
 Click on chart to enlarge State and local government employers spent an average of $42.51 per hour worked for employee compensation in September 2013. Wages and salaries averaged $27.38 per hour and accounted for 64.4 percent of compensation costs, while benefits averaged $15.13 per hour worked and accounted for the remaining 35.6 percent. Total employer compensation costs for private industry workers averaged $29.23 per hour worked in September 2013. See the complete report at this link: USDOL-BLS |
10 December 2013
• U.S. Help-Wanted Advertising – November 2013
 Click on chart to enlarge: “’The theme for labor demand this year is up-one-month and down-the-next,’ said June Shelp, Vice President of The Conference Board. ‘Eleven months into the year, we’ve seen six months up and five months down, with a net result of basically flat labor demand (a gain of fewer than 18,000 per month).’ ”Since November 2012 employers’ demand for labor has been cautious. While the overall demand for labor has hovered around 5 million this year, the largest numerical gains since last year are for sales workers (+101,000), transportation workers (+71,000), and food service workers (+54,000). ”The most striking pattern is that many of the high-wage professional occupations have very modest gains. Since last November, demand for computer and math occupations has risen just 6,100 while business and finance occupations are up 4,700. Over the same period, the gains for construction workers (up 8,100) and production/manufacturing workers (up 7,000) are in the middle of the pack with relatively modest gains.” See the complete report at this link: The Conference Board |
• U.S. Labor Turnover – October 2013
•
 Click on chart to enlarge October’s turnover was lower than that of the prior month’s 4.833 million, but higher that that of the same month a year ago, 4.170 million. This yielded a monthly turnover level of 3.1% [the number of total separations during the entire month as a percent of total employment]…or 37.2% annualized.  See the complete report at this link: USDOL-BLS |
• U.S. Job Openings and Hires – October 2013

Hires: U.S. employers hired 4.746 million workers in October, down 1.6% from the previous month but up 5.3% from the same month a year ago. Source: USDOL-BLS Click on chart to enlarge |
06 December 2013
• U.S. 2014 Standard Mileage Rates for Business, Medical, and Moving
| The Internal Revenue Service today issued the 2014 optional standard mileage rates used to calculate the deductible costs of operating an automobile for business, charitable, medical or moving purposes.
Beginning on Jan. 1, 2014, the standard mileage rates for the use of a car (also vans, pickups or panel trucks) will be:  • 23.5 cents per mile driven for medical or moving purposes • 14 cents per mile driven in service of charitable organizations The business, medical, and moving expense rates decrease one-half cent from the 2013 rates. The charitable rate is based on statute. Taxpayers always have the option of calculating the actual costs of using their vehicle rather than using the standard mileage rates. A taxpayer may not use the business standard mileage rate for a vehicle after using any depreciation method under the Modified Accelerated Cost Recovery System (MACRS) or after claiming a Section 179 deduction for that vehicle. In addition, the business standard mileage rate cannot be used for more than four vehicles used simultaneously. These and other requirements for a taxpayer to use a standard mileage rate to calculate the amount of a deductible business, moving, medical, or charitable expense are in Rev. Proc. 2010-51. Notice 2013-80 contains the standard mileage rates, the amount a taxpayer must use in calculating reductions to basis for depreciation taken under the business standard mileage rate, and the maximum standard automobile cost that a taxpayer may use in computing the allowance under a fixed and variable rate plan. See for details: IRS.gov |
• U.S. Employment Situation -- November 2013
The unemployment rate declined from 7.3 percent to 7.0 percent in November, and total
nonfarm payroll employment rose by 203,000. Employment increased in transportation and warehousing, health care,
and manufacturing.
  Total nonfarm payroll employment increased by 203,000 in November. Job growth averaged 195,000 per month over the prior 12 months. In November, job gains occurred in transportation and warehousing, health care, and manufacturing. Employment in transportation and warehousing rose by 31,000 in November, with gains in couriers and messengers (+9,000), truck transportation (+8,000), warehousing and storage (+5,000), and air transportation (+3,000). Health care employment continued to increase over the month (+28,000). Job gains occurred in home healthcare services (+12,000) and offices of physicians (+7,000), while nursing care facilities lost jobs (-4,000). Job growth in health care has averaged 19,000 per month thus far this year, compared with an average monthly gain of 27,000 in 2012.  In November, employment in professional and business services continued to trend up (+35,000). Over the prior 12 months, the industry added an average of 55,000 jobs per month. Retail trade employment also continued to expand in November (+22,000). Within the industry, job growth occurred in general merchandise stores (+14,000); in sporting goods, hobby, book, and music stores (+12,000); and in automobile dealers (+7,000). Over the prior 12 months, job growth in retail trade averaged 31,000 per month. Within leisure and hospitality, employment in food services and drinking places continued to trend up in November (+18,000). Job growth in this industry averaged 28,000 per month over the prior 12 months. Employment in construction continued to trend up in November (+17,000). Monthly job gains in the industry averaged 15,000 over the prior 12 months. Federal government employment continued to decline (-7,000) in November. Over the past 12 months, federal government employment has decreased by 92,000. Employment in other major industries, including mining and logging, wholesale trade, information, and financial activities, showed little or no change in November. The average workweek for all employees on private nonfarm payrolls edged up by 0.1 hour to 34.5 hours in November. The manufacturing workweek edged up by 0.1 hour to 41.0 hours, and factory overtime edged up by 0.1 hour to 3.5 hours. The average workweek for production and nonsupervisory employees on private nonfarm payrolls edged up by 0.1 hour to 33.7 hours. In November, average hourly earnings for all employees on private nonfarm payrolls rose by 4 cents to $24.15. Over the year, average hourly earnings have risen by 48 cents, or 2.0 percent. In November, average hourly earnings of production and nonsupervisory employees increased by 3 cents to $20.31. See the complete report at this link: USDOL-BLS |
• U.S. Personal Income, Expenditures – October 2013
 In September, personal income increased $64.3 billion, or 0.5 percent, DPI increased $62.1 billion, or 0.5 percent, and PCE increased $23.8 billion, or 0.2 percent, based on revised estimates. Real disposable personal income decreased 0.2 percent in October, in contrast to an increase of 0.4 percent in September. Real PCE increased 0.3 percent, compared with an increase of 0.1 percent. See the complete report at this link: USDOL-BEA |
05 December 2013
• U.S. Metropolitan Area Employment And Unemployment -- October 2013
In October, 288 metropolitan areas had over-the-year increases in nonfarm
payroll employment, 75 had decreases, and 9 had no change. The largest over-
the-year employment increases occurred in New York-Northern New Jersey-Long
Island, N.Y.-N.J.-Pa. (+141,800), Dallas-Fort Worth-Arlington, Texas (+96,100),
and Los Angeles-Long Beach-Santa Ana, Calif. (+84,700). The largest over-the-
year percentage gain in employment occurred in Naples-Marco Island, Fla. (+7.6
percent), followed by Sebastian-Vero Beach, Fla. (+6.7 percent), and Crestview-
Fort Walton Beach-Destin, Fla. (+6.0 percent).
 See the complete report at this link: USDOL-BLS |
• U.S. Real Gross Domestic Product 2nd Estimate – Q3 2013
| Real gross domestic product -- the output of goods and services produced by labor and property
located in the United States -- increased at an annual rate of 3.6 percent in the third quarter of 2013 (that
is, from the second quarter to the third quarter), according to the "second" estimate released by the
Bureau of Economic Analysis. In the second quarter, real GDP increased 2.5 percent.
The increase in real GDP in the third quarter primarily reflected positive contributions from private inventory investment, personal consumption expenditures (PCE), exports, nonresidential fixed investment, residential fixed investment, and state and local government spending that were partly offset by a negative contribution from federal government spending. Imports, which are a subtraction in the calculation of GDP, increased. The acceleration in real GDP growth in the third quarter primarily reflected an acceleration in private inventory investment, a deceleration in imports, and an acceleration in state and local government spending that were partly offset by decelerations in exports, in PCE, and in nonresidential fixed investment. See the complete report at this link: USDOC-BEA |
• U.S. Initial Unemployment Claims – 30 November 2013
[Jobless]
In the week ending November 30, the advance figure for seasonally adjusted initial claims was 298,000, a decrease of 23,000 from the previous week's revised figure of 321,000.  The advance seasonally adjusted insured unemployment rate was 2.1 percent for the week ending November 23, unchanged from the prior week's unrevised rate. The highest insured unemployment rates in the week ending November 23 were in Alaska (5.5), Puerto Rico (3.7), Virgin Islands (3.3), New Jersey (3.2), California (3.1), Pennsylvania (2.9), Connecticut (2.8), Oregon (2.6), Illinois (2.5), and Nevada (2.5). The largest increases in initial claims for the week ending November 23 were in California (+8,326), Pennsylvania (+4,416), Michigan (+3,426), Illinois (+2,638), and Texas (+2,099), while the largest decreases were in New Jersey (-572), Florida (-492), Idaho (-293), Mississippi (-287), and Virginia (-72). Click on chart to enlarge Note: “Insured unemployment rate” refers to individuals who are unemployed and receiving UC benefits. Source: USDOL-BLS |